Energy is one of the main costs to Controlled Environment Horticulture businesses, with electricity being the most expensive form of energy per-kWh. GrowSave is running a series of articles where we detail how to understand an energy bill, and most importantly, how to mitigate the costs. In this, Part 1, we are covering the non-commodity elements within electricity bills.
How electricity is measured?
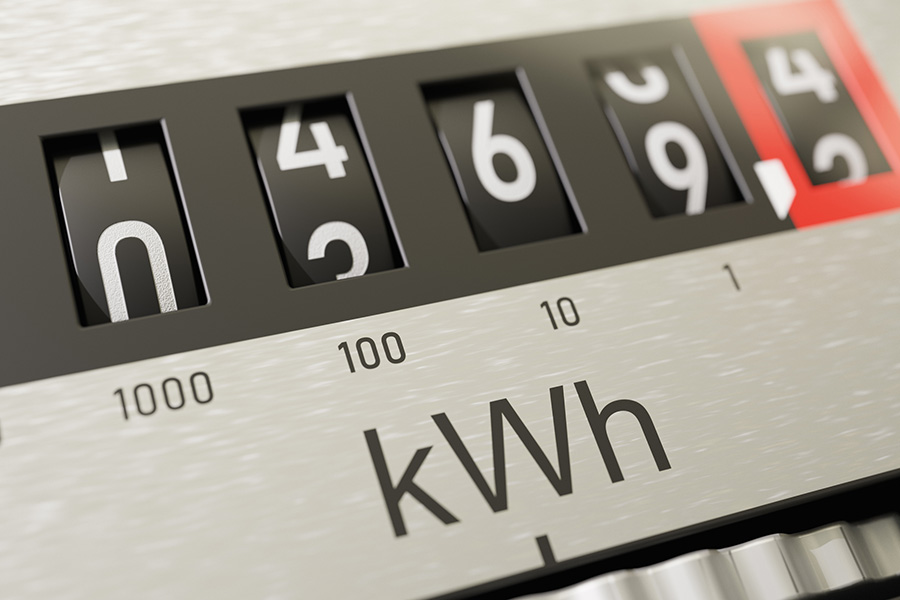
Electrical energy is measured (and usually billed) in kWh (kilowatt-hours) and is a volumetric measure. Electricity meters calculate the use, in kWh, by multiplying instantaneous power demand (kW) by the duration of power demand (h).
Note: this is “kW times hours”, not “kW per hour”. To calculate the energy used by a particular piece of equipment, take its power rating in kW and multiply it by the number of hours used. For example, a 5kW motor used for 10 hours will use 5 x 10 = 50kWh of electricity.
For larger users, energy use might be referred to in MWh (Megawatt-hours), where 1MWh is 1,000kWh.
What are non-commodity costs?
An electricity bill consists of several lines with costs associated with different parts of the supply. In the broadest terms, costs can be split into commodity (those where the charge is based on the volume of electricity purchased by the business in kWh) and non-commodity (those where the charge is not paid against the purchased volume of electricity).
Non-commodity costs mainly comprise standing charges, capacity charges, and Use of System (UoS) charges. These charges are paid based on the size of the grid connection in kVA, with the tariffs of either p/MPAN/day or p/kVA/day.
Every electricity supply has an associated MPAN (Meter Point Administration Number), which is a unique identifier for that supply and contains some important information such as whether it is half-hourly supply, the associated Distribution Network Operator (DNO), line loss factor, etc.
Depending on the voltage of your supply, it will fall into different categories, the most common being Low Voltage (LV), High Voltage (HV), or EHV (Extra High Voltage), each of which contains 4 capacity bands with unique tariffs.
| Voltage Banding | kVA Threshold[1] | |||
| LV | 1 | 0 | – | 90 |
| 2 | 90 | – | 150 | |
| 3 | 150 | – | 250 | |
| 4 | 250 | + | ||
| HV | 1 | 0 | – | 500 |
| 2 | 500 | – | 1,100 | |
| 3 | 1,100 | – | 2,000 | |
| 4 | 2,000 | + | ||
| EHV | 1 | 0 | – | 3,500 |
| 2 | 3,500 | – | 11,000 | |
| 3 | 11,000 | – | 20,000 | |
| 4 | 20,000 | + | ||
Most horticultural sites will fall into either LV or HV, depending on whether the crop is lit, if a packhouse/cold store is attached to the same supply, and whether there are multiple supply points. A further complication is that these costs are levied against suppliers by the DNO. Many suppliers, although not all, pass these costs directly to the consumer whilst some have their own bespoke costing mechanisms.
To help give context to these figures, the following table outlines the typical costs for the different bandings, excluding EHV as the figures are slightly more complex. Note, TNUoS figures are forecasts by the National Energy System Operator (NESO); final figures are expected before the end of January 2026.
| Voltage Banding | Fixed Charge | Capacity Charge | TNUoS | |
| £/year | £/year | £/year | ||
| LV | 1 | 444 | 1,315 | 2,655 |
| 2 | 749 | 3,448 | 5,259 | |
| 3 | 1,206 | 5,746 | 6,575 | |
| 4 | 2,491 | 9,337 | 17,605 | |
| HV | 1 | 2,545 | 8,087 | 14,325 |
| 2 | 6,897 | 25,861 | 53,487 | |
| 3 | 13,073 | 50,105 | 85,173 | |
| 4 | 33,049 | 72,734 | 243,747 | |
TNUoS
The Transmission Use of System (TNUoS) portion of non-commodity bills increased significantly since their implementation in 2023, with NESO forecasting further increases in the 2026-2030 period.
NFU Energy have developed a calculator to help you determine the impact of these proposed changes: TNUoS Charges Impact Calculator | NFU Energy
How Can These Costs Be Reduced?
Unlike commodity charges which can be reduced by using less energy, non-commodity costs are charged regardless of energy consumption and therefore must be tackled differently.
Many connections are oversized in anticipation of worst-case scenarios, planned expansions, or leftover from legacy equipment. Reviewing your connection capacity and the frequency that it is used is the first step in determining whether savings can be made.
By reducing your connection capacity, charges levied at a p/kVA rate will directly reduce. If your capacity can be reduced by at least 50%, you may be able to drop into a lower banding[2], which can have a significant impact on all the charges listed above.
If you operate multiple smaller supply points, you may also benefit from consolidating those into a single larger supply point. This is because fixed and TNUoS charges are per MPAN, so reducing the number of MPANs may reduce overall costs.
Although it doesn’t directly reduce the fixed cost, businesses with CHP can make better use of their supply point by increasing the number of operational power export hours (as long as they remain profitable hours). The additional income can offset the fixed costs of owning the grid connection.
The NFU has been making lobbying efforts, alongside NFU Energy and supported by GrowSave, to communicate the cost to the sector for increasing TNUoS rates. In particular, businesses on the Energy Intensive Industry (EII) list are provided a relief on certain aspects of their energy bills through the Network Charging Compensation (NCC) scheme, which includes 90% TNUoS relief.
Keep an eye out for future GrowSave posts for up-to-date news on this topic.
If you want some clarification on your energy bills, advice on your contract, or further consultancy on how to reduce your costs, contact us here: growsave@nfuenergy.co.uk.
[1] Some DNOs have slightly different thresholds, these figures reflect the updated kVA banding beginning financial year 2026
[2] The rules are that regardless of connection, capacity must reduce by at least 50% for a banding change
Related Content